


Organization strategies
Where rehearsal and elaboration strategies focus on words, organization strategies focus on techniques for organizing information to show relationships in an easier way. That makes the data easier to retrieve from long-term memory. There are four different types of organization strategies—clustering, outlining, mapping, and graphic organizers. We’ll examine each one and provide examples.
Clustering
Clustering is a nonlinear activity that generates ideas, images, and feelings around a stimulus word. It is visual brainstorming. As students cluster, their thoughts tumble out, enlarging their word bank for writing and often enabling them to see patterns in their ideas.
To cluster, you start with a stimulus word – and idea, word, or concept – circled in the center of a page. Then you associate ideas from the first word and write them in circles in any direction around the central word.
Tips include:
- Use short words or phrases;
- Use different colored pens for different groups;
- Don’t organize too neatly because that can impede the flow of ideas;
- Don’t cross anything out because you can’t tell where an idea may lead; and
- Draw linking lines as connections suggest themselves.
Outlining
We covered outlining in the last post when discussing ways to make notes. The key point about an outline is that it is a summary of main points and the ideas that support them. It is used to organize information in order from the most general to the more specific. It helps students remember information in an organized way. It shows relationships between ideas, and it separates big ideas from smaller details.
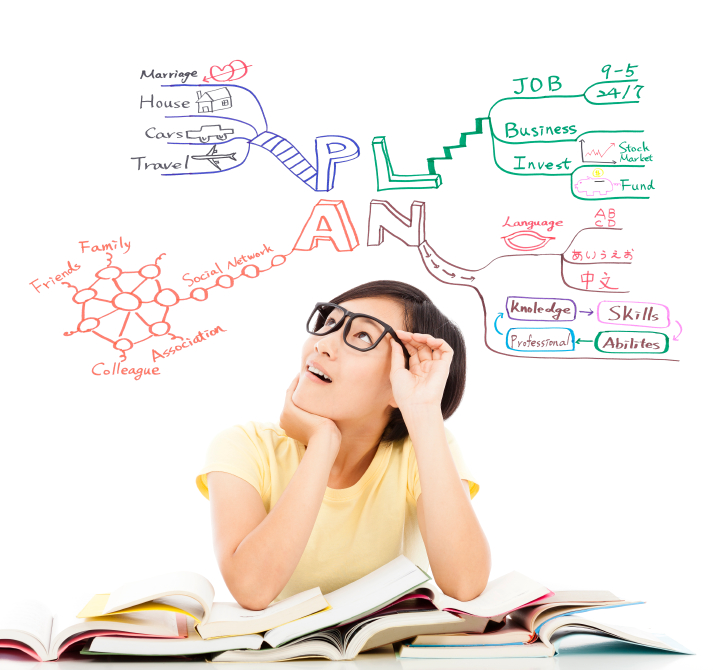
Mapping
We also covered mapping last time as part of note-making. Mapping is visual outlining; it is an extension of clustering. It uses more details than clustering and will often show multiple circles with radiating spokes or lines. As we’ve said before, it’s a graphic way to relate ideas. Its big value is that it can often encapsulate an entire talk or text on one page with good detail.
Graphic Organizers
The fourth type of organization strategy is the use of graphic organizers. These are visual communication devices that show the structure and relationship of ideas. By organizing information spatially, it reduces the cognitive demand on the learner. There is less to process but the full scope of ideas can still be considered. This format is useful for gifted as well as remedial students including English learners. The research supports this wide application.
Graphic organizers are a compelling tool to use for three reasons. First, the information tends to be less “fuzzy” and more precise. This helps students separate what is important from what is just interesting. Second, by having the content shown rather than told, the discussions can be more sophisticated, leading to greater understanding. Third, the act of constructing graphic organizers challenges students to think analytically and creatively. They have to recognize patterns in a text.
One of the criticisms of graphic organizers is that “it’s just putting information into little boxes.” This overlooks what it takes to actually get the information organized. It’s this before-and-after activity that is key to the successful use of graphic organizers. Students have to use higher-order thinking skills, such as using cues to recognize important information, make decisions, summarize data, and identify main ideas and details. They also have to determine the best way to structure the graphic to present the information. Essentially, they are making connections, finding patterns, identifying rules, and abstracting principles in order to create meaning.
Once the information is organized, the ensuing discussions involve students in prioritizing and elaborating on the information. It challenges them to draw conclusions and inferences, make connections, and decide on planning steps that will further clarify the information.
There are six types of text structures that students can organize into a graphic:
- Cause and Effect. Students identify how one thing affects another. This is often used in science or history. For example, a table could show a column of causes of air pollution, and another column for the effects of it on the people and the planet.
- Chronological. Information is organized in time order. A table could be made showing the beginning, middle, and ending of a story. Or a timeline could show the order of events.
- Compare and Contrast. Two or more concepts, sources, themes, etc. are described by noting their similarities and differences in a table. One example is comparing plant and animal cells.
| Feature | Animal Cells | Both | Plant Cells |
| Cell wall | Yes, formed by cellulose | ||
| Shape | Round or irregular | Rectangular | |
| Chloroplast | Yes, because they make their own food | ||
| Cytoplasm | Yes | ||
| Nucleus | Yes | ||
| Centrioles | Yes |
- Categorical. This shows a whole and parts, or the hierarchy of a system. For example, students could analyze the key points of a speech this way, or the structure of government.
- Sequential. This is most often used for steps or procedures. You might see this in biology with the steps of mitosis, or in weather reports with a sequence of photos of a storm.
- Evaluative (Problem-Solution). Here a problem is described and a solution is noted. Often it is seen as a pro and con table, or advantages and disadvantages. For example, students could evaluate the pros and cons of uniforms in schools.
There are also specialized types of graphics for special needs such as project planning or goal setting. These are often seen as flow charts, cycle diagrams, or pie charts.
Conclusion
Organization strategies externalize the thinking process into a visual chart. They are a great way to condense information and focus a discussion. They are useful for a wide array of teaching styles and most subjects. They are easy to implement for all types of students. Using boxes, charts, and tables to clarify information is a cognitive strategy that pays big dividends in terms of helping students learn better. Think visually!
Next post will look at metacognitive strategies.